Setting up secure Prometheus Federated Servers – Step by Step

In case you have multiple environments and networks but you still would like to manage Prometheus monitoring from one central location, one option is to set up Federation. Federation allows a Prometheus server to scrape selected time series from another Prometheus server. This is basically a master and slave configuration where the slave is acting like a beefed up exporter, exposing data from all the exporters in the network where it is located.

Architecture

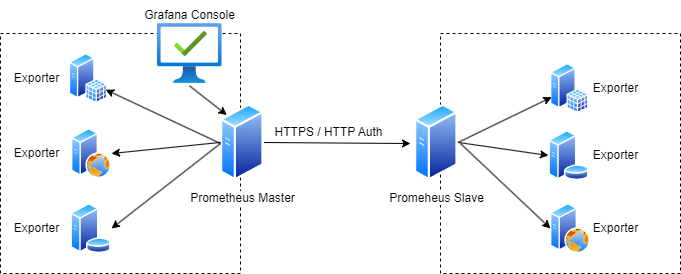
In this example scenario we have 2 Prometheus servers where the Prometheus Master is scraping information from not only the exporters in its own network but from the Prometheus slave server too over HTTPS and using HTTP Authentication.

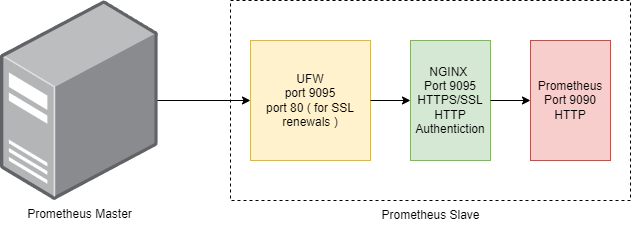
Prometheus doesn’t have any built in authentication nor can it use SSL certificates. We used NGINX proxying to achieve https communication and http url authentication along with local firewall settings.

Implementation

We assume that the Master Prometheus server is already installed and working correctly with the local exporters along with visualization using Grafana. In this implementation example we will focus on setting up the Slave Prometheus and to change the configuration of the Master Prometheus to enabled federation.

We used an aws t3.micro instance for the Slave Prometheus server. Once the OS is set up we will perform the following steps:

  • Set up firewall rules.
  • Set up Nginx and Certbot.
  • Set up SSL Certificates.
  • Create http password
  • Configure Nginx.
  • Set up and configure Slave Prometheus Server.
  • Configure Master Prometheus Server.

Set up Firewall Rules

We use ufw to configure the local Ubuntu firewall. We will need to open the following ports:

  • 9095 – This will be the SSL port for the Slave Prometheus Server.
  • 80 – This is required by certbot to run its own webserver when it tries to auto-renew the certficiates.
  • 22 – SSH port.

Since ufw is available on the ubuntu image we are using, all we have to do is to run the relevant commands to configure the ports. We would only want the Master Prometheus server to access port 9095 so replace x.x.x.x with the external ip of your Master Prometheus server.

sudo ufw allow from x.x.x.x proto tcp to any port 9095/tcp
sudo ufw allow 80/tcp
sudo ufw allow 22/tcp
sudo ufw enable

Set up Nginx and Certbot

The next step is to install NGINX web server and certbot which will generate the certificates for us. We will also need to install apache2-utils to be able set the http auth password later.

 sudo apt install nginx apache2-utils -y
 sudo snap install --classic certbot
 sudo ln -s /snap/bin/certbot /usr/bin/certbot

Create HTTP password

In this step we will create the user and password for the http authentication. Let use prometheus-admin as username. Specify a password of your choice when prompted.

 sudo htpasswd -ci /etc/nginx/.htpasswd prometheus-admin

This command creates the /etc/nginx/.htpasswd file which will contain the username and password ( in encrypted format ). These credentials will be used for the Prometheus Master to connect to the Prometheus Slave.

Set up SSL Certificates

We will use certbot now to create the SSL certfificates. The prerequisite for this process is that the hostname of the Prometheus Slave is DNS resolvable. Let’s say the resolvable name of our server is prometheus-slave.example.com we will use this throughout the example.

 sudo certbot certonly --standalone --noninteractive --agree-tos --cert-name prometheus-slave -d prometheus-slave.example.com -m info@example.com -v

This will create the certificates for you in the /etc/letsencrypt/live/prometheus-slave directory.

Add the following to your crontab, this command will try to renew the certificates automatically every 12 hours and restarts the nginx server when it runs successfully.

0 */12 * * * /usr/bin/certbot renew --quiet && /usr/bin/systemctl restart nginx

Configure Nginx

We will now create the nginx.config file. Create the file into a directory location of your choice.

server {
    listen 9095 ssl;
    server_name prometheus-slave.example.com;
    ssl_certificate /etc/letsencrypt/live/prometheus-slave/fullchain.pem;
    ssl_certificate_key /etc/letsencrypt/live/prometheus-slave/privkey.pem;
    ssl_dhparam /snap/certbot/current/lib/python3.8/site-packages/certbot/ssl-dhparams.pem;

    location / {
        auth_basic "Prometheus Slave";
        auth_basic_user_file /etc/nginx/.htpasswd; 
        proxy_pass http://localhost:9090; 
        proxy_set_header Host $host;
        proxy_set_header X-Real-IP $remote_addr;
        proxy_set_header X-Forwarded-For $proxy_add_x_forwarded_for;
        proxy_set_header X-Forwarded-Proto $scheme;
    }
}

Now we need to copy and enable the configuration on nginx. We will also delete the default nginx configuration. Execute this command sequence from the location where you created the nginx.config file.

 sudo service nginx stop 
 sudo cp ./nginx.config /etc/nginx/sites-available/nginx.config
 sudo rm -rf /etc/nginx/sites-enabled/nginx.config
 sudo ln -s /etc/nginx/sites-available/nginx.config /etc/nginx/sites-enabled/nginx.config
 sudo rm -rf /etc/nginx/sites-enabled/default
 sudo service nginx start

Set up and configure Slave Prometheus Server

The next step is to download and set up Prometheus on the Prometheus Slave server. The following steps will be followed:

  • Create the Prometheus user.
  • Download the latest Prometheus version.
  • Copy the files to binary directory.
  • Edit the prometheus.yaml file to start scraping your local exporters.
  • Enable Prometheus linux service and start operating the product

We now create the Prometheus user.

 sudo useradd --system --no-create-home --shell /bin/false prometheus

We now use the following script to download the latest Prometheus version from github.

#!/bin/bash
ARCH="linux-amd64"

GITHUB_URL="https://api.github.com/repos/prometheus/prometheus/releases/latest"
RELEASE_DATA=$(curl -s $GITHUB_URL)

VERSION=$(echo $RELEASE_DATA | grep -oP '"tag_name": "\K(.*?)(?=")')
ASSETS_URL=$(echo $RELEASE_DATA | grep -oP '"browser_download_url": "\K(.*?)(?=")' | grep "$ARCH.tar.gz")

if [[ -z "$VERSION" ]] || [[ -z "$ASSETS_URL" ]]; then
    echo "Failed to find the latest Prometheus version or the download URL."
    exit 1
fi

wget "$ASSETS_URL" -O prometheus-${VERSION}-${ARCH}.tar.gz || curl -L "$ASSETS_URL" -o prometheus-${VERSION}-${ARCH}.tar.gz
echo "Extracting Prometheus $VERSION..."
tar xvf prometheus-${VERSION}-${ARCH}.tar.gz

We now have the latest Prometheus version downloaded and extracted. Let’s move the files to their final location and create the required directories. Run the following command sequence from the same directory where the prometheus files have been extracted.

 export DIRNAME=$(find . -type d -name "prometheus*" -print -quit)
 cd $DIRNAME
 sudo mkdir -p /data /etc/prometheus
 sudo mv prometheus promtool /usr/local/bin/
 sudo mv consoles/ console_libraries/ /etc/prometheus/
 sudo mv prometheus.yml /etc/prometheus/prometheus.yml
 sudo chown -R prometheus:prometheus /etc/prometheus/ /data/

Edit the /etc/prometheus/prometheus.yml file and add your local exporters. As an example we add a job with the name of CoreSystems and add 4 targets to the group. We use the internal ip address and hostname for the targets so scraping traffic is only happening on the internal network. You would typically have to append each job definition at to end of the file.

# my global config
global:
  scrape_interval: 15s # Set the scrape interval to every 15 seconds. Default is every 1 minute.
  evaluation_interval: 15s # Evaluate rules every 15 seconds. The default is every 1 minute.
  # scrape_timeout is set to the global default (10s).

# Alertmanager configuration
alerting:
  alertmanagers:
    - static_configs:
        - targets:
          # - alertmanager:9093

# Load rules once and periodically evaluate them according to the global 'evaluation_interval'.
rule_files:
  # - "first_rules.yml"
  # - "second_rules.yml"

# A scrape configuration containing exactly one endpoint to scrape:
# Here it's Prometheus itself.
scrape_configs:
  # The job name is added as a label `job=<job_name>` to any timeseries scraped from this config.
  - job_name: "prometheus"

    # metrics_path defaults to '/metrics'
    # scheme defaults to 'http'.

    static_configs:
      - targets: ["localhost:9090"]
# -------------------------
# Custom targets and groups start here
# --------------------------
  - job_name: 'CoreSystems'
    static_configs:
    - targets: ['core01.example.internal:9100']
    - targets: ['core02.example.internal:9100']
    - targets: ['core03.example.internal:9100']
    - targets: ['core04.example.internal:9100']
      labels:
        group: 'CoreSystems Monitoring'

Check the syntax if the configuration file.

 sudo /usr/local/bin/promtool check config /etc/prometheus/prometheus.yml

Create a linux service file called prometheus.service using the following example.

[Unit]
Description=Prometheus
Wants=network-online.target
After=network-online.target

StartLimitIntervalSec=500
StartLimitBurst=5

[Service]
User=prometheus
Group=prometheus
Type=simple
Restart=on-failure
RestartSec=5s
ExecStart=/usr/local/bin/prometheus \
  --config.file=/etc/prometheus/prometheus.yml \
  --storage.tsdb.path=/data \
  --web.console.templates=/etc/prometheus/consoles \
  --web.console.libraries=/etc/prometheus/console_libraries \
  --web.listen-address=0.0.0.0:9090 \
  --web.enable-lifecycle

[Install]
WantedBy=multi-user.target

Run the commands below from the directory where you created the service file. This will create the prometheus linux service, enable it to autostart at reboot and at the same time will start the service.

sudo cp prometheus.service /etc/systemd/system/
sudo systemctl daemon-reload
sudo systemctl enable prometheus
sudo systemctl start prometheus
sudo systemctl status prometheus

Your Prometheus Slave server is now set up.

Configure Master Prometheus Server

As the Prometheus Master Server has already been set up all we need to do is to add a new job at the end of the /etc/prometheus/prometheus.yaml file to enable scraping from the Prometheus Slave Server. Very likely you already have some other jobs configured in that configuration file, you do not need to remove them, they will be compatible with the federated setup. Change the user and the password at the bottom of the file to whatever you are used at the http credentials setup.

This configuration will scrape everything that is available on the Slave Prometheus Server. if you only need to scrape specific data you can set that up at the params section.

  - job_name: 'federate'
    scrape_interval: 15s
    honor_labels: true
    metrics_path: '/federate'
    params:
      'match[]':
        - '{__name__=~".+"}'
    static_configs:
      - targets: ['prometheus-slave.example.com:9095']
    scheme: https
    basic_auth:
      username: 'prometheus-admin'
      password: 'YOUR PASSWORD'

Once you have appended the above to the end of your /etc/prometheus/prometheus.yaml file, run the following to check and reload the configuration.

sudo /usr/local/bin/promtool check config /etc/prometheus/prometheus.yml
curl -X POST http://localhost:9090/-/reload

Your federated Prometheus servers are now set up.

How to configure NGINX Load Balancer on Ubuntu 22?

Introduction

In this post we will set up a Load Balancer using the nginx‘s HTTP Load Balancing on Ubuntu 22. The requirement was that the load balancer is running over https and balances the connections for 4 polkadot based RPC servers. Please note that this setup would work with any other environments including standard web servers over https.

Prerequisities

  • Ubuntu 22 is set up on the Load Balancer server.
  • All backend servers are created and working properly.
  • the loadbalancer domain lb.yourdomain.com is redirecing correctly to the server.

Create SSL certficate

We use certbot to create the SSL certificate for lb.yourdomain.com using the following commands:

sudo snap install --classic certbot
sudo ln -s /snap/bin/certbot /usr/bin/certbot
sudo certbot certonly --standalone --noninteractive --agree-tos --cert-name lb -d lb.yourdomain.com -m yourmail@yourdomain.com -v

This will generate 2 certificate files:

/etc/letsencrypt/live/lb/fullchain.pem
/etc/letsencrypt/live/lb/privkey.pem

Install nginx server.

sudo apt install nginx  -y

Create the nginx.conf file and add the content below and replace the domain and SSL parameters with your settings.

upstream backend {
server server1.yourdomain.com:443;
server server2.yourdomain.com:443;
server server3.yourdomain.com:443;
server server4.yourdomain.com:443;
}

server {
        server_name lb.yourdomain.com;
        root /var/www/html;
        location / {
          try_files $uri $uri/ =404;
          proxy_buffering off;
          proxy_pass https://backend;
          proxy_set_header X-Real-IP $remote_addr;
          proxy_set_header Host $host;
          proxy_set_header X-Forwarded-For $proxy_add_x_forwarded_for;
          proxy_http_version 1.1;
          proxy_set_header Upgrade $http_upgrade;
          proxy_set_header Connection "upgrade";
        }
        listen [::]:443 ssl ipv6only=on;
        listen 443 ssl;
        ssl_certificate /etc/letsencrypt/live/lb/fullchain.pem;
        ssl_certificate_key /etc/letsencrypt/live/lb/privkey.pem;
        ssl_dhparam /snap/certbot/current/lib/python3.8/site-packages/certbot/ssl-dhparams.pem;
        ssl_session_cache shared:cache_nginx_SSL:1m;
        ssl_session_timeout 1440m;
        ssl_protocols TLSv1 TLSv1.1 TLSv1.2;
        ssl_prefer_server_ciphers on;
        ssl_ciphers "ECDHE-ECDSA-CHACHA20-POLY1305:ECDHE-RSA-CHACHA20-POLY1305:ECDHE-ECDSA-AES128-GCM-SHA256:ECDHE-RSA-AES128-GCM-SHA256:ECDHE
-ECDSA-AES256-GCM-SHA384:ECDHE-RSA-AES256-GCM-SHA384:DHE-RSA-AES128-GCM-SHA256:DHE-RSA-AES256-GCM-SHA384:ECDHE-ECDSA-AES128-SHA256:ECDHE-RSA-A
ES128-SHA256:ECDHE-ECDSA-AES128-SHA:ECDHE-RSA-AES256-SHA384:ECDHE-RSA-AES128-SHA:ECDHE-ECDSA-AES256-SHA384:ECDHE-ECDSA-AES256-SHA:ECDHE-RSA-AE
S256-SHA:DHE-RSA-AES128-SHA256:DHE-RSA-AES128-SHA:DHE-RSA-AES256-SHA256:DHE-RSA-AES256-SHA:ECDHE-ECDSA-DES-CBC3-SHA:ECDHE-RSA-DES-CBC3-SHA:EDH
-RSA-DES-CBC3-SHA:AES128-GCM-SHA256:AES256-GCM-SHA384:AES128-SHA256:AES256-SHA256:AES128-SHA:AES256-SHA:DES-CBC3-SHA:!DSS";
}

Copy the nginx.conf file to its final destination and remove the old config.

sudo cp --verbose nginx.conf /etc/nginx/sites-available/nginx.conf
sudo ln -s /etc/nginx/sites-available/nginx.conf /etc/nginx/sites-enabled/nginx.conf
sudo rm -rf /etc/nginx/sites-enabled/default

Restart the nginx server to activate your configuration.

sudo service nginx restart

Even though certbot schedules automatic renewal of the SSL certificates, it won’t restart the nginx server. The new certificates to take effect if the nginx server is restarted after the SSL cert renewal, so alternatively you can add the following line to crontab.

0 */12 * * * /usr/bin/certbot renew --quiet && /usr/bin/systemctl restart nginx

This will try to renew the SSL certificate every 12 hours and if it was successful will restart the nginx server.

How to add country flag to Youtube Video Title – Step by Step Guide

After watching a number of badly made and unnecessarily long youtube videos on how to do this I decided to write a very simple and quick explanation on how to add a flag to your youtube title. I hope this will help others and saves time.

  • Copy the highlighted flag icon.
  • Start editing your youtube video title and paste the icon there.
  • Once pasted it should display the flag in the title.
  • That’s it folks as easy as this.

How to Fix Spinning Blue Circle Windows 10

This morning I encountered a never ending spinning circle on my laptop. After some research it was clear that one of the applications were faulty. I have checked the application logs in the Event Viewer and I found that the UIhost.exe process was causing the issue.

After a quick google search it turned out that this process is associated with McAfee WebAdvisor. So the solution was to remove the McAfee WebAdvisor altogether. The never ending spinning blue circle issue is usually caused by a faulty executable and the easiest way to identify it is to check the Windows Event Viewer Application Logs.

The easiest way to execute the Windows Event Viewer is to search for “event” in the search field in the Window Start Menu like this:

A reference to a resource type must be followed by at least one attribute access, specifying the resource name.

There are multiple post going around on this error in my case the problem was caused by missing quotes around the value of provisioningMode. So instead of this:

resource "kubernetes_storage_class" "us-east-1a" {
  metadata {
    name = "us-east-1a"
  }
  storage_provisioner = "efs.csi.aws.com"
  reclaim_policy      = "Retain"
  parameters = {
    provisioningMode = efs-ap
    fileSystemId     = var.us-east-1a-vol
    directoryPerms   = "777"
  }
  mount_options = ["file_mode=0700", "dir_mode=0777", "mfsymlinks", "uid=1000", "gid=1000", "nobrl", "cache=none"]
}

Use this:

resource "kubernetes_storage_class" "us-east-1a" {
  metadata {
    name = "us-east-1a"
  }
  storage_provisioner = "efs.csi.aws.com"
  reclaim_policy      = "Retain"
  parameters = {
    provisioningMode = "efs-ap"
    fileSystemId     = var.us-east-1a-vol
    directoryPerms   = "777"
  }
  mount_options = ["file_mode=0700", "dir_mode=0777", "mfsymlinks", "uid=1000", "gid=1000", "nobrl", "cache=none"]
}

How to automatically register Gitlab Runners using runnerCreate GraphQL API mutation and Project Runners?

Gitlab has changed their Gitab Runner registration process from version 15.10. Previously there was a simple one step registration process where it was possible to register a runner by simply running gitlab-runner register command on the server/entity where the runner was installed. The old procedure was using a single registration token which was linked to the project and was used by all the runners registered for this one project.

The registration process now have changed from one step to two steps and each runner now will have to obtain their own unique authentication token.

Step 1: A new project runner will typically be created manually on the gitlab.com interface. ( scroll down for automation ).

Many of the options previously set from gitlab-runner register command as a parameter, now will be set here instead. Such as run-untagged, locked, tag-list, etc.

This new project runner will generate a unique authentication token.

Step 2: Run the gitlab-runner register command using this unique authentication token to link this runner with the project.

Needless to say that this breaks any kind of automation that has been created previously for runner registration so this would cause multiple issues for any customer using automatic registration.

After browsing some forums I found out that a new project runner can be created automatically using gitlab’s graphQL API. There is a mutation called RunnerCreate which does this part automatically. So running this call will return the authentication token, which then can be used to register the runner. I used the following call to get an authentication token:

mutation {
  runnerCreate(
    input: {projectId: "gid://gitlab/Project/00000000", runnerType: PROJECT_TYPE, tagList: "yourtag"}
  ) {
    errors
    runner {
	ephemeralAuthenticationToken
    }
  }
}

Replace the 00000000 with your project id and it should create a new project runner and return the authentication token.

I have also written a bash script that would automate the entire process end to end. The script should be running on the server/entity where the runner is installed.

 #!/usr/bin/bash
 export PRIVATE_TOKEN="Replace with your Personal Access Tokens" 
 # Go to Settings -> General and copy the numeric value from "Project ID".
 export PROJECT_ID="Replace with your Project ID" 
 export TAGLIST="yourtag" 
 export RUN_UNTAGGED="true"
 export LOCKED="true"
 # Change this is to your own hosted gitlab URL if you use gitlab.com  leave the value set.
 export GITLAB_URL="https://gitlab.com" 
 export TOKEN=$(curl "$GITLAB_URL/api/graphql" --header "Authorization:  Bearer $PRIVATE_TOKEN" --header "Content-Type: application/json" --request POST --data-binary '{"query": "mutation { runnerCreate( input: {projectId: \"gid://gitlab/Project/'$PROJECT_ID'\", runnerType: PROJECT_TYPE, tagList: \"'$TAGLIST'\", runUntagged: '$RUN_UNTAGGED', locked: '$LOCKED'} ) { errors runner { ephemeralAuthenticationToken } } }"}' |jq '.data.runnerCreate.runner.ephemeralAuthenticationToken' | tr -d '"')
 sudo gitlab-runner register --non-interactive --url $GITLAB_URL --token $TOKEN --executor shell

This script is also available on github.

How to install Ta-Lib and its python library on Ubuntu 22?

Installing TA-lib on an Ubuntu server has its challenges as not only the python library has to be installed but the product should be downloaded and compiled first. Use the following steps to perform the installation:

mkdir -p /app
sudo apt-get install build-essential autoconf libtool pkg-config python3-dev -y
cd /app
sudo wget http://prdownloads.sourceforge.net/ta-lib/ta-lib-0.4.0-src.tar.gz
sudo tar -xzf ta-lib-0.4.0-src.tar.gz
cd ta-lib/
sudo ./configure
sudo make
sudo make install
sudo pip3 install --upgrade pip
sudo pip3 install TA-Lib

In case you would be using gitlab pipelines you can use the following job to do the same:

 stages:
   - prepare

 prepare:
   stage: prepare
   script:
     - mkdir -p /app
     - sudo apt-get install build-essential autoconf libtool pkg-config       python3-dev -y
     - cd /app
     - sudo wget http://prdownloads.sourceforge.net/ta-lib/ta-lib-0.4.0-src.tar.gz
     - sudo tar -xzf ta-lib-0.4.0-src.tar.gz
     - cd ta-lib/
     - sudo ./configure
     - sudo make
     - sudo make install
     - sudo pip3 install --upgrade pip
     - sudo pip3 install TA-Lib

Happy trading!

Azure Terraform – Error: expected “user_data” to be a base64 string, got #!/usr/bin/bash

I am testing Azure setup with terraform to automate VM instance provisioning using user data scritps. User data is a set of scripts or other metadata that’s inserted to an Azure virtual machine at provision time. It rans right after the OS has been installed and the server boots. I would typically use it to update the os, install tools and software I would need on the provisioned node using a shell script which is defined as a data_template like this:

data "template_file" "init-wp-server" {
  template = file("./init-wp-server.sh")
}

I tried to speficy the user data file the same way I used to do on AWS and I was getting the following error:

Error: expected "user_data" to be a base64 string, got #!/usr/bin/bash

This is because Azure requires the user data file to be Base64-Encoded. So instead of using this in azurerm_linux_virtual_machine definiton:

  user_data = data.template_file.init-wp-server.rendered

The following shoud be used:

  user_data = base64encode(data.template_file.init-wp-server.rendered)

Azure Terraform Error – Please change your resource to Standard sku for Availability Zone support.

I am testing creating resources with Terraform on Azure. I have tried to force one AZ per public ip and I ran the following code:

# Create public IPs
resource "azurerm_public_ip" "external_ip" {
  count               = length(var.wp_test_instance_location)
  name                = "external_ip-0${count.index}"
  location            = azurerm_resource_group.rg.location
  resource_group_name = azurerm_resource_group.rg.name
  allocation_method   = "Dynamic"
  zones               = tolist([var.wp_test_instance_location[count.index], ])
  tags = {
    environment = "test"
    terraform   = "Y"
  }
}

Then I ran into the following error message:

Error: creating/updating Public Ip Address: (Name "external_ip-01" / Resource Group "rg-bright-liger"): network.PublicIPAddressesClient#CreateOrUpdate: Failure sending request: StatusCode=400 -- Original Error: Code="ZonesNotAllowedInBasicSkuResource" Message="Request for resource /subscriptions/[MASKED]/resourceGroups/rg-bright-liger/providers/Microsoft.Network/publicIPAddresses/external_ip-01 is invalid as it is Basic sku and in an Availability Zone which is a deprecated configuration.  Please change your resource to Standard sku for Availability Zone support." Details=[]

The issue is that the SKU setting for the public IP has to be Standard instead of Basic ( which is the default and I didn’t set it before ). Also the allocation_method parmaters has to be changed from Dynamic to Static. The corrected code looks like:

# Create public IPs
resource "azurerm_public_ip" "external_ip" {
  count               = length(var.wp_test_instance_location)
  name                = "external_ip-0${count.index}"
  location            = azurerm_resource_group.rg.location
  resource_group_name = azurerm_resource_group.rg.name
  allocation_method   = "Static"
  zones               = tolist([var.wp_test_instance_location[count.index], ])
  sku                 = "Standard"
  tags = {
    environment = "test"
    terraform   = "Y"
  }
}

StandardOutput log file is not updating after the linux service restarts

I ran into this issue recently. I have created a linux service on Ubuntu, defined the StandardOutput to redirect logging to a file and anytime I restarted the service the log file didn’t update.

The first problem was that the logfile actually did update but it updated from the beginning of the file keeping the older lines and updatig the logfile gradually which is a very weird behaviour I would say.

The way this was fixed is that I have changed the StandardOutput definition in my service file from:

StandardOutput=file:/var/log/application.log

to

StandardOutput=append:/var/log/application.log

This means if the file doesn’t exists it will be created if it does exits it will just append the new log lines to the existing file instead of update the file from the very beginning causing confusion.